Building and keeping wealth as a veteran in Illinois: what the public data actually shows.
You're seeing this with first. Start with the view that fits.
What matters most to you right now? (optional; it opens the page on the view that fits)
One thing up front: no public dataset can show you a veteran's net worth in Illinois. The federal survey that measures household wealth publishes no state numbers, so anyone who claims that figure is estimating. Here is what the public data can show, honestly. It can show what Illinois veterans actually earn, across the whole range and not just the average. It can show business ownership as a lasting asset a veteran can pass on. And it can show how the home loan benefit from the Department of Veterans Affairs (VA) changes the math on a house. Behind those three sits the national backdrop: what wealth looks like across all American households, clearly labeled as national. What none of it can tell you is whether a plan fits your household. That part is yours.
Your trade-offs
Showing starting points for every value. Pick values on the main page to see yours highlighted here.
Money and security
| Value | What you'd gain | What you'd give up |
|---|---|---|
| Income / earning ceiling | A higher income ceiling moves wealth more than almost anything else. Raises and job moves are the biggest levers you have. | Higher pay alone keeps nothing. Spending tends to grow with income unless you decide otherwise. |
| Security / stability | Money set aside is a shock absorber. Savings and more than one income stream can turn an emergency into an errand. | The cushion is built from spending you skip now. Safety this way is slow and quiet, and it can feel like nothing is happening. |
| Getting out of debt | A payoff plan puts you back in charge. The order you clear debts changes what each payment frees up next. | Paying debt down fast competes with saving and investing. The same dollar can only do one job. |
| Legacy / multi-generational | Things you own can outlive you and pass on: a home, a business, long-run savings. A wage stops when the work stops. | What transfers takes decades to build. The steady sacrifice happens now, and the people it serves may never see it. |
Self-direction and growth
| Value | What you'd gain | What you'd give up |
|---|---|---|
| Autonomy / self-direction | Money in reserve is options. Enough set aside means you can walk away from work that is wrong for you. | A strict plan is its own boss. Budgets and targets tell you no more often than any manager does. |
| Growth / learning | Learning how money works is a skill that compounds like the money does, and nobody can take it from you. | The learning is slow and unglamorous: statements, rates, taxes. There is no finish line where you feel done. |
| Mastery / craft | Handling money rewards craft. Small decisions done well, over and over, add up across years. | Your working craft can stall if every spare hour goes to managing money instead of getting better at what you do. |
| Adventure / new experiences | A funded life has room for real adventures, taken on purpose instead of on credit. | Steady saving is repetitive by design. If you want excitement from your money, this way of handling it will not feed that. |
People and connection
| Value | What you'd gain | What you'd give up |
|---|---|---|
| Family / partner / parenting time | Steady money removes one of the most common sources of stress at home. A plan gives the household solid footing. | Most wealth decisions are household decisions. A plan only holds if everyone carries it, and the tightest months test the whole house. |
| Love / partnership | Partners who plan money together tend to fight about it less. A shared plan can pull a couple in one direction. | Money is one of the most common things couples fight over. A strict plan can become the fight if only one of you chose it. |
| Community / friendship | Being the steady one means you can show up for people when it counts, without wobbling your own footing. | Saying no to rounds, trips, and big gifts has a social cost. Careful can read as distant to people you care about. |
Body, mind, and time
| Value | What you'd gain | What you'd give up |
|---|---|---|
| Physical health | Money stress wears on the body. A cushion buys sleep, and it buys care when you need it instead of when you can afford it. | Squeezing every dollar can squeeze the wrong places: cheaper food, skipped care, a gym cut to save a little. |
| Mental health / stress | Money set aside is quiet. Many people say a cushion lowered a background worry they had carried for years. | Watching accounts can become its own worry. Markets drop, and a long plan asks you to sit still through it. |
| Time / freedom of schedule | Wealth buys back time later: fewer forced hours, more options, maybe an earlier finish line. | The trade runs through years of now for later. The waiting is the price, and nobody hands those years back early. |
Meaning and service
| Value | What you'd gain | What you'd give up |
|---|---|---|
| Purpose / meaning | A clear money goal gives daily choices a direction. Progress you can see keeps many people going. | A number is not a purpose. Some people reach the goal and find the meaning was supposed to come from somewhere else. |
| Faith / spiritual practice | Stewardship is an old idea in most faiths. Handling money with care can line up with practice, including giving. | Building wealth can quietly become the point. Traditions that praise stewardship also warn about serving the pile itself. |
| Service / impact | Resources let you serve in ways time alone cannot: funding help, backing people, steadying others in a bad month. | The big giving comes after years of building. Serving with money later means saying not yet to some needs now. |
| Patriotism / love of country | Benefits you earned, like the VA home loan, exist so service turns into a stake in the country. Using them is the system working. | Earned benefits take paperwork and patience, and they do not reach everyone equally. Using what you earned is still work. |
The value you added:
How would building and keeping wealth serve it, and what might it cost? Use the reflection questions below.
These are starting points, not scores. Nothing here is weighted or ranked for you.
The Illinois data
Three views, read in order: what Illinois veterans actually earn across the whole range, how the VA home loan is actually used here, and veteran business ownership as an asset. Each one says what it can and can't tell you.
What Illinois veterans actually earn
This is the spine, and it is a range on purpose. A single average would hide more than it shows, so here is the whole distribution: the middle, the low end, and the high end, from the Census Bureau's anonymous person-level survey records for 2020 to 2024. Every bar carries a margin of error: a survey estimate is never exact, so the thin line shows how far off it could realistically be, not a mistake.
How to read the labels on this chart and the tables below: a percentile is a point in a ranked list, not a percent of people. The 90th percentile is the amount only the top 1 in 10 earn more than. It does NOT mean "90% of veterans earn this much." The 10th percentile is the floor where only 1 in 10 earn less. The 25th and 75th percentile mark the middle half: a quarter earn less than the 25th, a quarter earn more than the 75th. The median (the 50th percentile) is the exact middle.
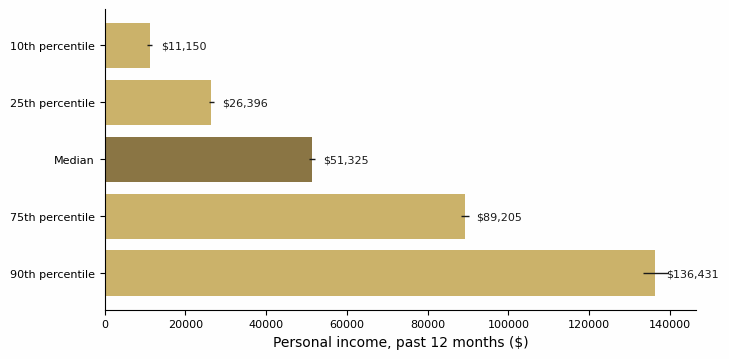
What Illinois veterans actually earn: personal income for the roughly 477,000 veterans 18 and older, from Census microdata (29,566 surveyed veterans, 2020 to 2024, in 2024 dollars). The middle veteran earned $51,325 a year, give or take $732. A tenth of veterans earned under $11,150; a tenth earned over $136,431. Every figure is a survey estimate; the thin black lines show the margin of error. This is the whole range the preview promised, not just the average. Income here is personal and pre-tax, and includes veterans with no work income (many are retired). [Source: U.S. Census Bureau, American Community Survey Public Use Microdata Sample, 2020 to 2024 five-year file for Illinois (file dated March 5, 2026). Margins of error computed with the Census Bureau's 80 replicate weights; the method is in the methodology note.]
The fair comparison: working-age veterans and nonveterans
Comparing all veterans with all nonveterans would mislead you, because Illinois veterans skew much older. Among working-age adults (25 to 64), here is the same survey, same years:
Same percentile columns as the chart above (25th percentile = a quarter earn less, 75th percentile = a quarter earn more):
| Illinois, ages 25 to 64 | 25th percentile | Median | 75th percentile |
|---|---|---|---|
| Veterans | $32,399 | $63,242 | $103,556 |
| Nonveterans | $19,520 | $48,039 | $86,024 |
The middle working-age veteran in Illinois out-earns the middle working-age nonveteran by about $15,200 a year in this survey window. Same source and margins as the chart; the full table with margins of error is in the download. Download the income data (CSV).
What this can and can't tell you: income here is personal, before taxes, and includes veterans with no work income, so retirees pull the low percentiles down. It is a snapshot of the range, not a track of any one person's earnings over time, and it says nothing about spending, saving, or wealth. It is where wealth-building starts, not where it ends.
This is information, not advice. You decide if it applies.
The VA home loan: the benefit in actual use
The VA home loan lets an eligible veteran buy a home with no down payment and no private mortgage insurance (the extra monthly fee lenders usually charge buyers who put down less than 20%). That changes the math on the biggest purchase most households make. Here is how much it is actually used in Illinois: the share of all home loans in the state that were VA-guaranteed, year by year.
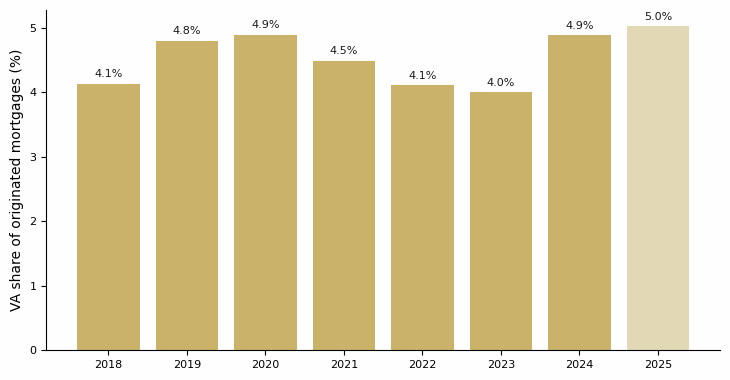
The share of all Illinois mortgages that were VA-guaranteed loans, 2018 to 2025. In 2024, 10,157 Illinois home loans (4.9% of all originations) were VA loans, averaging about $306,445. The low-rate years were the high mark: 25,371 VA loans in 2020, many of them refinances. The lighter, starred bar is preliminary 2025 data. Loan amounts in this dataset are rounded to the nearest $10,000 by the regulator before release, so every dollar figure here is approximate. [Source: Home Mortgage Disclosure Act (HMDA) data, Federal Financial Institutions Examination Council (FFIEC) and Consumer Financial Protection Bureau (CFPB), accessed July 2, 2026.]
The VA's own books tell the same story from the other side: in fiscal year 2024 the VA guaranteed 8,593 Illinois loans worth about $2.5 billion. Most went to Gulf War era veterans, and a good share were veterans using the benefit again after an earlier VA loan was paid off. The benefit is reusable. The era-by-era table is in the download (2 small counts are masked at the source to protect privacy): era table (CSV) and the year-by-year share (CSV).
[Source: U.S. Department of Veterans Affairs, VA Home Loan Guaranty program data for fiscal year 2024 (data.va.gov), accessed July 2, 2026.]
What this can and can't tell you: usage is not a verdict. The chart shows how many Illinois households used the benefit, not whether it beat their alternatives, and a VA loan's value depends on rates, fees, and the house itself. In an older federal count, about 4.1% of Illinois veterans used the benefit in a single year (2010 figure; the share rose each year through 2015, and the veteran count behind it is a modeled estimate). Usage in any one year is naturally a small share of all veterans, and low usage says nothing about whether the loan fits you. All loan amounts from HMDA are rounded to the nearest $10,000 before release.
This is information, not advice. You decide if it applies.
Business ownership as an asset
A salary stops when the work stops. A business can be sold, handed down, or run by someone else, which is why this path treats ownership as a wealth question, not just a job question. Here is what veteran business ownership in Illinois actually looks like in the Census Bureau's business survey.
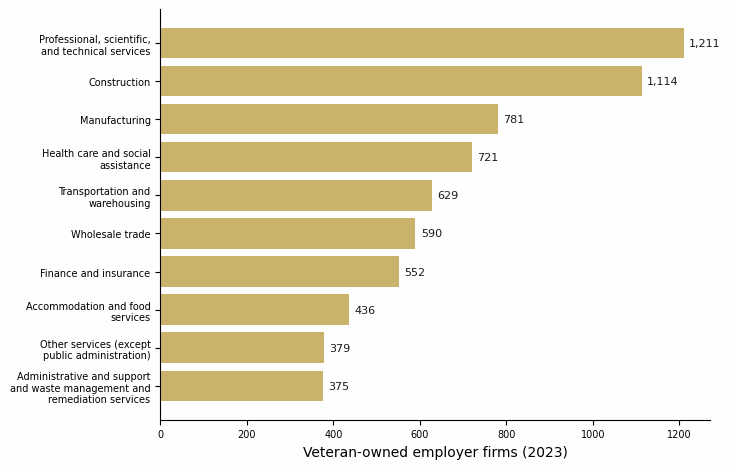
Veteran-owned employer businesses in Illinois by industry, from the Census Bureau's 2023 Annual Business Survey. Statewide, an estimated 8,170 employer firms are veteran-owned, about 3.4% of Illinois employer businesses. Together they took in about $50.6 billion and employed about 121,617 people. These are survey estimates with real sampling error (the statewide firm count carries about 9.6% either way); 5 industry cells were suppressed or too thin to publish and are left out, not guessed at. The chart shows the 10 largest of 14 published sectors; the 4 smaller ones are in the download, which is why the bars add to less than the statewide total. Download the sector data (CSV). [Source: U.S. Census Bureau, Annual Business Survey, 2023 survey year (files dated January 8, 2026). Employer firms only; businesses with no employees are counted in a separate Census program.]
One more read, and it is national: veteran-owned businesses skew older. Across the United States, 39% of veteran-owned employer firms have been in business 16 years or more, against 32% of all firms. (National figure, all states; veteran-owned firms compared with all firms, not Illinois-specific.) It fits the asset framing: the veteran-owned business population is weighted toward businesses that lasted. [Source: U.S. Census Bureau, Annual Business Survey, 2023 survey year, national years-in-business table.]
What this can and can't tell you: these are survey estimates of employer businesses whose ownership is classified, by filing state. A veteran-owned firm registered in Illinois can operate anywhere, and the survey can't see side businesses with no employees. Ownership share is not a success rate: the data counts businesses that exist, not the ones that closed along the way. The Founder path covers survival odds directly.
This is information, not advice. You decide if it applies.
The national backdrop: what wealth looks like, and the gap I can't fill
Here is the honest limit of this page. The federal survey that measures household wealth, the Survey of Consumer Finances from the Federal Reserve, publishes no state detail at all. So veteran net worth in Illinois is not a number anyone can honestly give you. What the national survey can show is the shape of American household wealth: how it stacks by age, how it splits between owners and renters, and, with wide error bars, how families with military service compare. Everything in this section is national and all-households, and it stays that way.
Household net worth, nationally
Same percentile reading as the Illinois income exhibit above (25th percentile = a quarter of families have less, 75th percentile = a quarter have more).
| Group | 25th percentile | Median | 75th percentile | Families surveyed |
|---|---|---|---|---|
| All U.S. families | $27,000 | $192,700 | $659,000 | 4,595 |
| Under 35 | $3,900 | $39,040 | $152,550 | 613 |
| 35 to 44 | $19,100 | $135,300 | $415,000 | 763 |
| 45 to 54 | $51,310 | $246,700 | $800,000 | 820 |
| 55 to 64 | $81,770 | $364,270 | $1,122,200 | 1,026 |
| 65 to 74 | $87,000 | $410,000 | $1,176,100 | 866 |
| 75 or older | $93,551 | $334,700 | $975,200 | 507 |
| Homeowner families | $158,300 | $396,500 | $1,042,300 | 3,111 |
| Renter and other families | $200 | $10,412 | $43,610 | 1,484 |
| Respondent or spouse ever served (incl. National Guard) | $102,800 | $296,200 | $866,600 | 603 |
| No military service | $21,370 | $169,420 | $613,600 | 3,992 |
National, all U.S. households; not veteran-specific, not Illinois. Net worth is everything a family owns minus everything it owes. Two rows worth sitting with: the median homeowner family ($396,500) against the median renter family ($10,412), and families where the respondent or spouse ever served ($296,200) against families with no military service ($169,420). The military row includes National Guard service and currently serving members, comes from about 600 surveyed families, and carries wide uncertainty; read it as a rough national read, never as an Illinois number. Download this table (CSV). [Source: Board of Governors of the Federal Reserve System, Survey of Consumer Finances, 2022 wave, public data; computed from the public files, accessed July 2, 2026. Public-file dollar values are rounded by the Fed's disclosure process.]
The long view: home prices since 1963
Wealth-building runs on time, so here is the longest honest yardstick in the public data: the price of the middle American house, adjusted for inflation, since 1963.
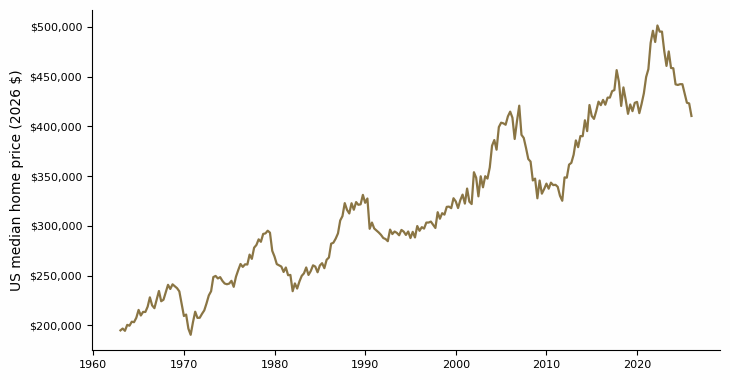
National, all home sales; not veteran-specific, not Illinois. The United States median home sales price since 1963, adjusted to 2026 dollars using the Consumer Price Index. Even after inflation, the national median rose from about $195,062 to about $410,408. For scale on the other big asset classes: the 10-year Treasury yield sits near 4.4% today, and inflation itself has averaged about 3.5% a year since 1947. History, not a forecast. [Sources: U.S. Census Bureau and U.S. Department of Housing and Urban Development (median sales price), U.S. Bureau of Labor Statistics (Consumer Price Index), and U.S. Department of the Treasury (10-year Treasury yield), all via FRED, Federal Reserve Bank of St. Louis, accessed July 2, 2026.]
What this can and can't tell you: the national median house is not any particular house, boom-and-bust cycles are visible right on the chart, and history is not a forecast. The point is narrower: over decades, owning assets has been how ordinary American households built net worth, and that is the mechanism the Illinois exhibits above connect to. Download the price series (CSV).
This is information, not advice. You decide if it applies.
What tends to predict building and keeping wealth
Almost nothing in the wealth research has a veteran-specific or Illinois-specific cut, so unlike the exhibits above, these findings are national and all-households unless marked otherwise. Net-worth medians match the table above; a few figures the table doesn't carry come from the Federal Reserve's published report, which rounds slightly differently. Each finding closes the same way on purpose: this is information, not advice. You decide if it applies.
-
Income moves wealth more than almost anything else measured.
In the Federal Reserve's national wealth survey, the middle American family was worth $192,700 in 2022 (the table above). Families in the bottom fifth by income had a median net worth of $14,000; families in the top tenth had over $2.5 million. National, all households, and the link runs both ways: income builds wealth, and wealth helps income. That is why this page put the Illinois income distribution first. [Federal Reserve Board, Changes in U.S. Family Finances from 2019 to 2022, October 2023; median recomputed from the 2022 public files.]
This is information, not advice. You decide if it applies.
-
People who start saving automatically mostly keep saving.
The strongest causal evidence in this entire set: when one large U.S. company switched new hires from sign-up-yourself to automatic 401(k) enrollment, participation at the same point of tenure jumped from 37% to 86%, with nothing about the plan's economics changing. A quarter-century later the pattern still holds at scale: in one recordkeeper's plans covering millions of workers, 94% of employees participate under automatic enrollment against 64% under voluntary sign-up. How the saving starts turns out to matter enormously. [Madrian and Shea, Quarterly Journal of Economics, 2001; Vanguard, How America Saves 2026.]
This is information, not advice. You decide if it applies.
-
Time in the market did the heavy lifting, historically.
From 1928 through 2025, $100 left in U.S. stocks (with dividends reinvested) grew to about $1.16 million. The same $100 in 10-year Treasury bonds grew to about $7,800. That is roughly 10% a year against 4.5% a year, compounded over 98 years, before taxes and fees. It also comes from the one major stock market that ran uninterrupted the whole century, which flatters the number. It is history, not a forecast, and it says nothing about any particular decade. What it shows is the size of the gap that time and compounding created for households that owned assets. [Aswath Damodaran, New York University Stern School of Business, Historical Returns on Stocks, Bonds and Bills 1928 to 2025; the annualized math is documented in the methodology note.]
This is information, not advice. You decide if it applies.
-
Homeowner and renter families sit in different wealth worlds.
In the same national survey, the median homeowner family had a net worth of $396,500; the median renter family had $10,412 (the table above). That gap is no proof that buying causes wealth: families with more income and wealth are the ones who can buy in the first place, and the 2019 to 2022 housing boom flattered the numbers. But it is why the VA home loan exhibit above matters on a wealth page: for eligible veterans, that benefit is a veteran-specific door into homeownership, which is where most middle-class net worth sits. A single house is also a large amount of borrowed money riding on one asset in one place; the honest check below carries that counterweight. [Federal Reserve Board, Survey of Consumer Finances 2022; medians recomputed from the public files.]
This is information, not advice. You decide if it applies.
-
A VA disability rating comes with steady, inflation-protected income. It is conditional.
The one genuinely veteran-specific item in this list. For veterans with a service-connected disability rating, VA disability compensation is a monthly, tax-free payment on a published federal rate table: about $180 a month at a 10% rating up to about $3,939 a month at 100% for a veteran alone, at the rates effective December 2025. By law it rises with the same cost-of-living adjustment as Social Security. Read the condition carefully: this exists only with a rated disability. It is compensation tied to an injury, not a floor everyone gets, and nothing on this page says who qualifies. If you believe you have a service-connected condition, the claims process (free help exists; see the Advocate path) is where that question gets answered. [U.S. Department of Veterans Affairs, veteran compensation rate table, effective December 1, 2025, va.gov.]
This is information, not advice. You decide if it applies.
More research: four more things worth knowing, and one popular claim that failed the check
Same rule as above: all of this is information, not advice. You decide what applies.
Higher-income households save a bigger share, not just more dollars. Across three independent national datasets, saving rates rise with lifetime income. The study is about all U.S. households, and the direction of cause is debated, but the pattern is one of the steadiest in the literature. [Dynan, Skinner, and Zeldes, Do the Rich Save More?, Journal of Political Economy, 2004.]
Whether compounding can start often depends on the employer. In 2025, 72% of private-industry workers had access to a retirement benefit at work, but access ran from 59% at small employers to 90% at large ones. A job choice is quietly also a retirement-plan choice. [U.S. Bureau of Labor Statistics, Employee Benefits in the United States, March 2025.]
A quarter of workers leave employer match money unclaimed. In the largest public study of it, one in four employees did not save enough to collect their full employer 401(k) match, walking past an average of about $1,336 a year. The study is from 2015, from one advice firm's client base, and no newer study of that scale exists; the current mechanics still apply, with the average plan requiring about a 6.4% contribution to collect the full match. [Financial Engines, Missing Out, 2015; Vanguard, How America Saves 2026.]
On debt, finishing accounts predicted finishing the plan. In account-level records from a debt-settlement program, people who fully closed individual accounts were more likely to finish eliminating their debt, regardless of the dollar size of the accounts they closed. The sample is people already in debt trouble, so it may not generalize. The arithmetic point stands separately: paying the highest-interest debt first minimizes total interest, as math, not as a study finding. [Gal and McShane, Journal of Marketing Research, 2012.]
And one that failed: "the wealthy have multiple income streams." The preview of this page said the full version would test whether more than one income stream actually matters, with citations. Tested: the popular claim (often quoted as "65% of millionaires have three or more income streams") traces back to one self-published survey of 233 people with no public methodology, and no citable primary research on income-stream counts and staying wealthy exists for U.S. households. What the national data does support is narrower: about 20% of U.S. families own a private business, nearly half of top-income-decile families do, and business-owning families have higher income and wealth on average, with heavy selection effects. The multiple-streams rule of thumb may be fine advice or may not; the data can't say. [Federal Reserve Board, Survey of Consumer Finances 2022 bulletin.]
Timing that might matter
Up to two clocks, depending on your situation, and one non-clock. The non-clock first: the VA home loan benefit does not expire. There is no deadline to use it, it can be used more than once, and entitlement can be restored after a home is sold and the loan repaid. The compounding evidence above is itself a quiet clock: in both the automatic-enrollment and the long-run-returns evidence, earlier starts show bigger effects, whatever the amount. [U.S. Department of Veterans Affairs, VA-backed home loan eligibility and entitlement restoration, va.gov.]
The caregiving years
If you have aging parents, caregiving demand often peaks while parents are in their late 70s and 80s. Nearly half of care recipients are 75 or older, and the typical family caregiver is around 50: the same years most careers peak. Those two clocks often run at the same time.
[National Alliance for Caregiving and AARP, Caregiving in the U.S. 2025.]
This is information, not advice. You decide if it applies to your situation.
Tell the page your age band and values on the main page and any timing notes that fit will appear here.
What I can't show you
- The headline gap: no public dataset can show you a veteran's net worth in Illinois. The federal wealth survey has no state detail, and nothing else measures household wealth at that cut. This page shows income, ownership, and the home-loan door as the closest honest proxies, and says exactly what is missing.
- Income here is personal and pre-tax. It is not household income, not take-home pay, and every figure is a survey estimate with a margin of error, not a count of every veteran.
- Business data is by filing state. A veteran-owned firm registered in Illinois can operate anywhere, and businesses with no employees are not in the survey used here.
- VA-loan volume is not any one buyer's experience. The data shows aggregate usage, not whether the benefit beat the alternatives for anyone, and the loan amounts are rounded to the nearest $10,000 at the source.
- The national backdrop is national. Nothing from the Federal Reserve sources on this page is veteran-specific or Illinois-specific, and the military-service wealth row carries wide error bars from about 600 surveyed families.
- No returns promise. Long-run asset returns are history, not a forecast, and nothing here says what any strategy will do for you.
- The biggest one: the public numbers track income and ownership, not whether a strategy fits your household, your debts, your risks, or your plans. That judgment is not in any dataset.
Should you stay or go?
If you're weighing other states, here are the same wealth-relevant reads, computed the same way from the same sources, for the states veterans often weigh against Illinois. The honest summary: Illinois veterans' median income sits a few thousand dollars below the western comparison states, and close to the national veteran median. The VA loan is used less here than in the big military-base states. None of these numbers accounts for what living costs in each state. That difference is real.
Wealth-building measures, by state
| Measure | Illinois | California | Texas | Colorado | Washington |
|---|---|---|---|---|---|
| Veteran median income (a year) | $53,526 | $59,258 | $58,337 | $62,496 | $60,846 |
| VA share of 2024 home loans | 4.9% | 4.8% | 10.4% | 9.7% | 8.6% |
| VA loans per 10,000 veterans (FY2024) | 180 | 153 | 318 | 325 | 223 |
Veteran median income is from the Census Bureau's 5-year survey estimates (2020 to 2024; the national veteran median is $54,224). The VA-loan share is VA-guaranteed loans as a share of all 2024 mortgage originations in that state; loans per 10,000 veterans pair fiscal-year-2024 VA guaranty counts with Census veteran-population estimates. Same caveats in every state: survey error, no cost-of-living adjustment, and usage is not a verdict. Download the state table (CSV).
Weighing a specific state I didn't include? Tell me with the Share feedback link at the bottom of this page and I'll prioritize it.
Taxes change with your state
Where you legally reside changes how your military retirement and VA disability income are taxed, and what property-tax breaks you qualify for. Illinois doesn't tax retirement income, including military retirement. Texas and Florida have no state income tax, and both offer up to a full homestead property-tax exemption for 100% disabled veterans. California still taxes military retirement above a partial exclusion (up to $20,000 a year starting with tax year 2025, with income limits, and that provision is set to expire before 2030). If "should you stay or go" is a real question for you, the tax math is part of the answer. Verify against each state's revenue department before you decide.
[Illinois Department of Revenue; Texas Comptroller; Florida Statutes; MOAA state tax updates. Verify with each state's revenue department.]
This is information, not advice. You decide if it applies to your situation.
An honest check before you decide
- Most wealth decisions are household decisions. Who else carries this plan with you, and have they actually agreed to it, or just heard about it?
- What is the order of operations for your money right now: which debts, which savings, which purchases first? The research above informs the order; only you know your interest rates and your risks.
- Concentration cuts both ways. A house or a business can be the engine of your net worth and also most of your risk in one place. If your biggest asset lost a third of its value, what would break?
- The blind spot this page named: no data can tell you where your own net worth is headed. If you tracked one number a year, would it be the one your plan is actually built on?
Thinking of building the asset yourself instead of buying one? See the Founder path. Weighing steadier income first? See the Career-changer path.
Before you go
Get updates when new data or a new path ships (one confirmation email first, unsubscribe anytime). Or answer three quick feedback questions; your answers tell me whether to keep building these.
Support the work · offsets the data and build costs. Optional.