Which Illinois industries held steadiest for veterans: what the public data actually shows.
You're seeing this with first. Start with the view that fits.
What matters most to you right now? (optional; it opens the page on the view that fits)
One thing up front: no dataset can tell you how long any one veteran will stay employed. Illinois's own sample of veterans in the federal jobs survey is too small to publish that cut honestly. What the public data CAN show, honestly, is which Illinois industries held employment steadiest through two real downturns, what that steadiness costs in wages, and where Illinois veterans already work in large numbers today, from federal-contractor filings. Those three things sit side by side below, general workforce data next to a separate veteran overlay, never blended into one number. What none of it can tell you is whether steady work is right for you.
Your trade-offs
Showing starting points for every value. Pick values on the main page to see yours highlighted here.
Money and security
| Value | What you'd gain | What you'd give up |
|---|---|---|
| Income / earning ceiling | A dependable paycheck and, in several of the steadiest industries, real benefits: paid leave and health coverage that don't depend on a good year. | The ceiling is usually lower and slower to move. Raises tend to follow tenure or a pay scale, not a big swing in performance. |
| Security / stability | Some Illinois industries barely dipped through the last two downturns. Choosing one of them is a real, data-backed lever. | Stability is about the industry, not any one employer or role inside it. A steady sector can still lay off a slow performer. |
| Getting out of debt | A predictable paycheck makes a payoff plan easy to build and easy to trust. You can schedule it and expect it to hold. | The same paycheck that makes the plan reliable also caps how fast it can go. A big income jump to accelerate payoff is less likely here. |
| Legacy / multi-generational | Some of the steadiest industries, especially government and manufacturing, still carry real retirement benefits that build for decades. | Legacy here builds slowly through savings and pension credit, not through owning something that can grow fast, like a business. |
Self-direction and growth
| Value | What you'd gain | What you'd give up |
|---|---|---|
| Autonomy / self-direction | Clear lanes. In a structured, steady industry, you usually know exactly what's yours to decide and what isn't. | Structure cuts both ways. The same rules and hierarchy that make the job predictable also limit how much you can decide on your own. |
| Growth / learning | Several stable industries, especially health care and education, have real, structured ladders: certifications, licenses, and clear next steps. | The ladder is often prescribed, not open-ended. You grow inside a defined track more than you invent your own path. |
| Mastery / craft | Some of the steadiest sectors, especially skilled trades and manufacturing, reward getting genuinely good at one thing over years. | Mastery here is bounded by the role. Moving to a different craft usually means starting over somewhere else. |
| Adventure / new experiences | A steady industry can still change what you do year to year, especially inside a large employer with many roles. | Predictability is close to the opposite of adventure. An industry is stable partly because it doesn't change much, and neither will your days. |
People and connection
| Value | What you'd gain | What you'd give up |
|---|---|---|
| Family / partner / parenting time | Some of the steadiest industries also run some of the steadiest schedules, which makes routines like school pickup easier to plan around. | Not every stable industry runs a 9-to-5. Health care, government field work, and manufacturing shifts can still land on evenings, nights, or weekends. |
| Love / partnership | A predictable paycheck and schedule remove a common source of strain between partners: not knowing what's coming. | Predictable isn't the same as exciting. Some partners want more variety or upside than a steady path offers. |
| Community / friendship | Staying in one industry, sometimes one employer, for years builds deep, long relationships with the same people. | Less movement between jobs and industries can narrow your circle over time compared with paths that push you into new rooms. |
Body, mind, and time
| Value | What you'd gain | What you'd give up |
|---|---|---|
| Physical health | A predictable schedule makes it easier to protect sleep, meals, and a workout routine, since the calendar doesn't move much. | Some of the steadiest industries, especially construction and manufacturing, carry real physical wear and higher injury rates than the average job. |
| Mental health / stress | Predictability lowers the kind of chronic uncertainty that wears on people over time. Many veterans report this specifically. | A steady job isn't automatically a fulfilling one. Boredom and a sense of being stuck can carry their own quiet weight. |
| Time / freedom of schedule | Steady jobs tend to run steady hours, so you usually know today what next month looks like. | That same steadiness means less room to change it. Shift-based and scale-based schedules are often set for you, not by you. |
Meaning and service
| Value | What you'd gain | What you'd give up |
|---|---|---|
| Purpose / meaning | Several of the steadiest industries, health care, education, government, are also directly service-oriented work. | Stability alone doesn't guarantee purpose. A steady job with no sense of mission is one of the most common complaints about this path. |
| Faith / spiritual practice | A predictable schedule makes it easier to keep a consistent practice: the same day, the same time, week after week. | Shift work in some stable industries, health care especially, can land on the exact hours your practice needs. |
| Service / impact | Some of the steadiest industries this data points to, government and education and health services among them, are inherently public-service work. | The impact is steady and incremental, not the direct frontline work of building something new, closer to the Advocate path. |
| Patriotism / love of country | Government employment, one of the steadiest sectors in the data, is direct public service, continued past your time in uniform. | Most other stable industries, manufacturing and utilities among them, don't carry that same direct civic framing. |
The value you added:
How would choosing a steady industry serve it, and what might it cost? Use the reflection questions below.
These are starting points, not scores. Nothing here is weighted or ranked for you.
The Illinois data
Four views, read in order: which industries held steadiest through two downturns, how stable employment is right now paired with what it pays, where Illinois veterans already work in large numbers, and which federal contractors kept hiring veterans across both years of filings in hand. The steadier, lower-risk industries in this data are not automatically the best-paid ones; every stability figure here describes the general workforce in an industry, not any one veteran's job security.
Which industries held steadiest through two downturns
Employment doesn't fall evenly across a recession. Some industries barely dip; others lose a third of their jobs and take a decade to recover. Here is how far each Illinois industry's employment fell from its pre-recession peak, and how long it took to climb back, through the 2008 recession and the 2020 pandemic downturn.
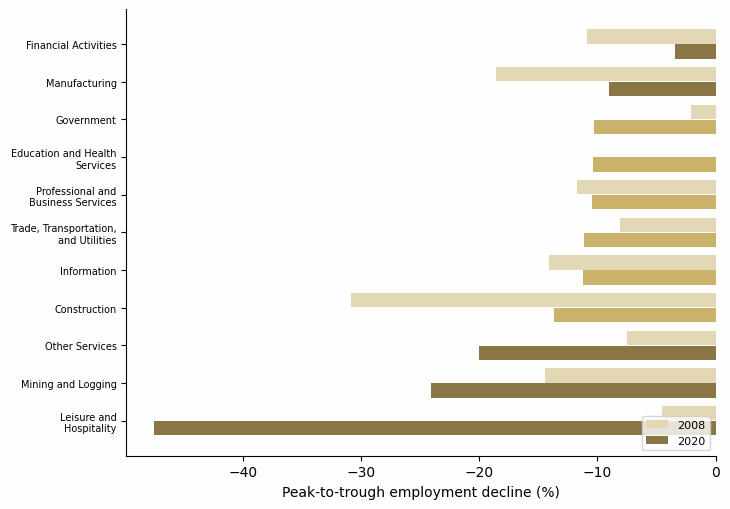
General-workforce employment, not veteran-specific (see the veteran concentration overlay below). How far each Illinois industry's employment fell from its peak, and how long it took to climb back, through the 2008 recession and the 2020 pandemic downturn. No single industry stayed steady through both: Education and Health Services barely dipped in 2008 (down only 0.0%) but fell 10.4% in 2020, while Financial Activities held steadiest through 2020, down only 3.4%. Leisure and Hospitality fell hardest in 2020, down 47.5%. As of the latest data, 5 of 11 industries still haven't climbed back to their pre-2020 employment level. This covers two downturns, not a forecast of the next one. Download the sector data (CSV). [Source: U.S. Bureau of Labor Statistics, Current Employment Statistics, State and Area, Illinois, 1990 to July 2026, accessed July 7, 2026.]
What this can and can't tell you: this is general-workforce employment by industry, not veteran-specific, and it covers two downturns, not a forecast of the next one. An industry that held steady in 2008 was not automatically steady in 2020, and the reverse. Recovery time is measured against each industry's own pre-downturn peak headcount, using the latest available monthly data.
This is information, not advice. You decide if it applies.
The stability measure, and what it costs
Peak-to-trough decline shows history. This is the current picture: a purpose-built stability rate from the Census Bureau's Quarterly Workforce Indicators, the share of jobs in an industry that did NOT turn over in a quarter, for every Illinois industry with usable data. Steadiness has a price tag, so every stability figure here sits next to that industry's national wage level in the same chart.
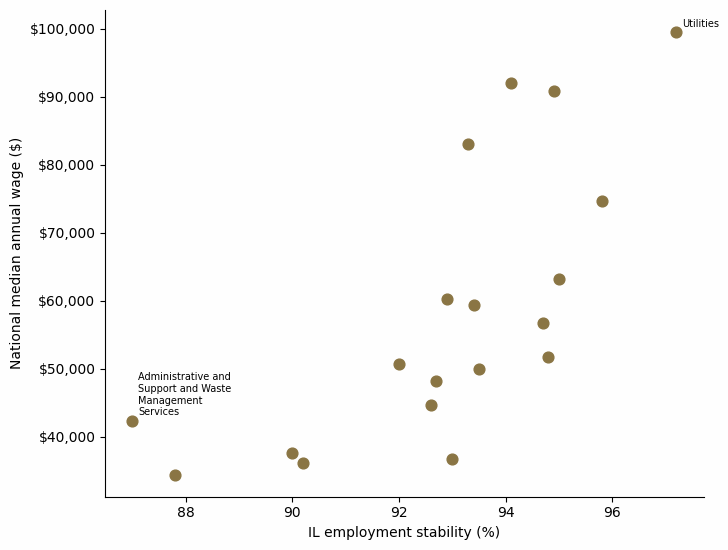
General-workforce data, not veteran-specific. Each point is an industry: how stable employment was in Illinois in 2025 Q1 (the share of jobs that did NOT turn over that quarter), against the national median wage for that same industry. Utilities was the most stable at 97.2%, paying a national median of $99,480. Administrative and Support and Waste Management Services was the least stable at 87.0%. National wage floor, not Illinois-specific. Illinois does not publish its own industry-level wage floors (see the methodology note). Steadiness has a price tag either way: read the stability number next to the wage, never one without the other. Download this data (CSV). [Sources: U.S. Census Bureau, Longitudinal Employer-Household Dynamics Program, Quarterly Workforce Indicators, 2025 Q1 (accessed July 7, 2026); U.S. Bureau of Labor Statistics, Occupational Employment and Wage Statistics, national industry file, accessed July 7, 2026.]
What this can and can't tell you: the wage figures here are a national wage floor, not Illinois-specific. Illinois does not publish its own industry-level wage floors, only industry-level wages combined across the whole state, or Illinois-specific wages combined across all industries, never both cuts at once. Pandemic-distorted quarters are excluded from the stability measure, not smoothed over. This is general-workforce data (see the veteran overlay next).
This is information, not advice. You decide if it applies.
Where Illinois veterans already work
This is the overlay, not a stability measure. Federal contractors above a certain size file a yearly report to the U.S. Department of Labor (DOL) called the VETS-4212 report, a required veteran-hiring headcount by industry. Here is where Illinois veterans already concentrate in those filings, which is a different question from which industries are steadiest or best-paid.
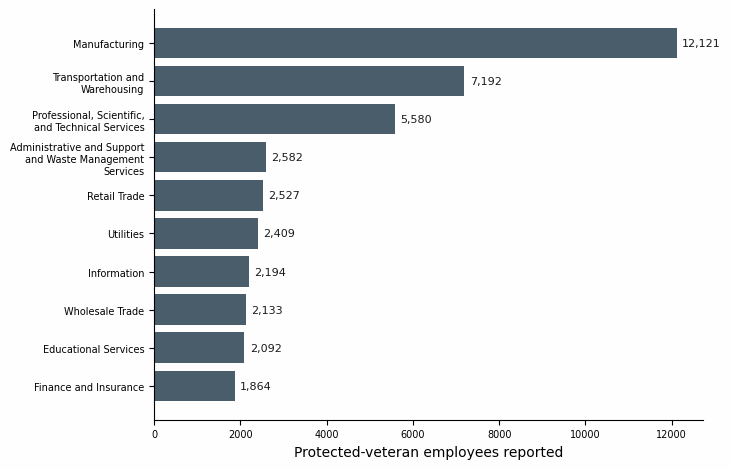
This is a separate overlay, not a stability measure: where federal contractors already report the most protected-veteran employees in Illinois, from DOL VETS-4212 filings. Manufacturing reports the most, 12,121 protected-veteran employees (3.1% of that industry's reported workforce in these filings). This shows where veterans already are, not whether those industries are the steadiest (compare against the chart above) or the best-paid (compare against the chart before that). Download this data (CSV). [Source: U.S. Department of Labor, VETS-4212 Federal Contractor Veterans' Employment Report Data, accessed July 7, 2026.]
What this can and can't tell you: VETS-4212 only covers federal contractors and subcontractors above a filing threshold, not every Illinois employer, so this shows concentration within that filing universe, not the whole labor market. It says where veterans work, not why, and it is never blended into the stability or wage figures above.
This is information, not advice. You decide if it applies.
Federal contractors that kept hiring veterans
"Kept hiring veterans year over year" means one specific thing here: filed a VETS-4212 report with at least one protected-veteran employee in BOTH FilingCycle 2024 and FilingCycle 2025. That is a real two-year window, not a longer track record, because that is what the cached filings cover.
857 of 2,800 Illinois federal-contractor establishments (31%) reported at least one protected-veteran employee in BOTH FilingCycle 2024 and FilingCycle 2025, this page's definition of "kept hiring veterans year over year." This is a two-year window, not a longer trend: the cached filings only cover these two cycles. The download has the full list; the table below shows the 10 with the largest reported 2025 protected-veteran headcount. Download the full list (CSV). [Source: U.S. Department of Labor, VETS-4212 Federal Contractor Veterans' Employment Report Data, accessed July 7, 2026.]
| Employer | Protected veterans, 2024 | Protected veterans, 2025 |
|---|---|---|
| CONSTELLATION ENERGY GENERATION LLC | 1674 | 1694 |
| COMPASS GROUP | 678 | 1122 |
| UPS | 930 | 876 |
| University of Illinois | 840 | 862 |
| American Airlines | 554 | 658 |
| FORD MOTOR COMPANY | 748 | 622 |
| GENERAL DYNAMICS CORPORATION | 476 | 582 |
| United Continental Holding Inc. | 1308 | 554 |
| NORTHROP GRUMMAN CORPORATION | 560 | 516 |
| CHS INC | 32 | 492 |
What this can and can't tell you: "kept hiring" here means nonzero reported protected-veteran headcount in both cycles, not growth, not net new hires, and not that the same individuals stayed employed. It is a two-year window (2,800 establishments, 857 of them, 31%), not a multi-year trend.
This is information, not advice. You decide if it applies.
What steady work costs, three ways
Three more reads on the same trade-off, one per lens. All three are general-workforce figures, not veteran-specific and, except where noted, not Illinois-specific.
Income lens: benefits access varies a lot by industry
Paid sick leave and employer healthcare access differ sharply by industry, nationally. Among private-industry workers, Information reports 93% healthcare-benefit access; Leisure and Hospitality reports 36%. Paid sick leave access ranges from 55% (Leisure and Hospitality) to 97% (Information). National, not Illinois-specific. Download this data (CSV). [Source: U.S. Bureau of Labor Statistics, National Compensation Survey - Benefits, accessed July 7, 2026.]
Time lens: the commute, and who skips it
About 15.9% of Illinois workers reported working from home in the latest Census survey. Among everyone else, about 51% have a commute under 25 minutes, and about 20% commute 45 minutes or more. Illinois-specific. Download the commute data (CSV) and the work-from-home data (CSV). [Source: U.S. Census Bureau, American Community Survey, 2020 to 2024 five-year estimates, accessed July 7, 2026.]
Invest-first lens: steadier work isn't automatically safer work
Nationally, private industry overall reported 2.3 total recordable workplace injury and illness cases per 100 full-time workers in 2024; health care and social assistance, one of the industries in the stability data above, reported 3.4. National, not Illinois-specific; these figures are cited directly from BLS's published release rather than pulled from an industry-by-industry breakdown, a limit named plainly rather than guessed around. [Source: BLS Survey of Occupational Injuries and Illnesses (SOII), 2023-2024 annual release (published 2026-01-22, USDL-26-0101), https://www.bls.gov/news.release/osh.nr0.htm, accessed July 7, 2026.]
This is information, not advice. You decide if it applies.
What tends to predict success on this path
These findings are general workplace and organizational-psychology research, not veteran-specific and not Illinois-specific: no clinical or veteran-specific mental-health claim appears here. Each finding closes the same way on purpose: this is information, not advice. You decide if it applies.
-
Job insecurity itself is a documented stressor, not just the layoff.
A meta-analysis covering 57 published studies found job insecurity significantly associated with anxiety, worse physical health, and lower wellbeing, even after controlling for a person's baseline mental health. The effect shows up before any job is actually lost: the uncertainty is its own cost, distinct from unemployment itself. This is the closest general finding to the stub's claim that "predictability helps"; it holds up.
[De Witte, Pienaar, and De Cuyper, "Review of 30 Years of Longitudinal Studies on the Association Between Job Insecurity and Health and Well-Being," Australian Psychologist, 2016.]This is information, not advice. You decide if it applies.
-
Job tenure hasn't actually collapsed the way it's often described.
The popular version of this claim says today's workers hop jobs far more than previous generations. The government's own tenure survey tells a narrower story: for wage and salary workers 25 and older, median tenure has held at roughly five years for the past 40 years. The one real decline, the widely cited "3.9 years" headline figure, is driven mostly by age composition (more young workers with naturally short tenure in a strong labor market), not by same-age workers churning faster than their counterparts did decades ago.
[Employee Benefit Research Institute, "Trends in Employee Tenure, 1983 to 2024"; U.S. Bureau of Labor Statistics, Employee Tenure news release, January 2024.]This is information, not advice. You decide if it applies.
-
Job switchers don't always out-earn job stayers. That flipped recently.
For most of the past 15 years, workers who switched employers saw faster wage growth than workers who stayed put, sometimes by a wide margin. Starting in 2025, that reversed: for the first time since the Great Recession, workers who stayed in their jobs saw slightly faster wage growth than workers who switched. The gap is narrow and it can flip again, but "switching always pays more" is not a stable rule; it depends on the labor market at the time.
[Federal Reserve Bank of Atlanta, Wage Growth Tracker, accessed July 7, 2026.]This is information, not advice. You decide if it applies.
Timing that might matter
Recovery from a downturn is not instant, and it isn't even across industries; the chart above shows how long each one actually took. This path doesn't carry a personal benefit clock the way the GI Bill or VA home loan paths do; the timing that matters most here is macro, not individual, and it's charted above.
Tell the page your values on the main page and any timing notes that fit will appear here.
What I can't show you
- The headline gap: no dataset can tell you how long any one veteran will stay employed in an industry. Illinois's sample of veterans in the federal jobs survey (about 270 respondents a year) is too thin to publish that cut without either violating privacy rules or carrying error bars too wide to be honest. This page shows general-workforce stability by industry, plus a separate veteran concentration overlay, and says exactly what's missing between them.
- Stability here is general-workforce data. It says which industries held up historically for everyone working in them, not whether any specific employer, role, or veteran will.
- The wage figures paired with stability are national, not Illinois-specific. Illinois does not publish its own industry-by-industry wage floors.
- The federal-contractor data (both the veteran concentration overlay and the "kept hiring" figure) only covers federal contractors and subcontractors above a reporting threshold, not the whole Illinois labor market.
- "Kept hiring veterans" covers two filing cycles, 2024 and 2025. It is not a longer trend, and it is not proof that the same individual veterans stayed employed.
- No forecast. Stability here measures the past two downturns; it is not a prediction about the next one.
- The biggest one: the public numbers track industries and employers, not whether steady work fits your household, your risk tolerance, or your goals. That judgment is not in any dataset.
Should you stay or go?
For this path the more useful "stay or go" question isn't which state, it's which industry. The steadiest industry in Illinois right now and the most volatile one, side by side, on the same measures.
| IL employment stability (current quarter) | Steadier: Utilities: 97.2% | More volatile: Administrative and Support and Waste Management Services: 87.0% |
|---|---|---|
| National median wage | Steadier: Utilities: $99,480 | More volatile: Administrative and Support and Waste Management Services: $42,340 |
| 2020 downturn, peak-to-trough decline | Held steadiest through downturns: Financial Activities: 3.4% | Fell hardest in 2020: Leisure and Hospitality: 47.5% |
Utilities and Administrative and Support and Waste Management Services come from the same current-quarter stability measure charted above; the 2020-downturn row comes from the peak-to-trough chart, which is a different industry breakdown (CES publishes 11 broader groups; QWI publishes by narrower industry). Download the stability and wage data (CSV).
Weighing a specific state instead? Tell me with the Share feedback link at the bottom of this page and I'll prioritize it.
Taxes change with your state
Where you legally reside changes how your military retirement and VA disability income are taxed, and what property-tax breaks you qualify for. Illinois doesn't tax retirement income, including military retirement. Texas and Florida have no state income tax, and both offer up to a full homestead property-tax exemption for 100% disabled veterans. California still taxes military retirement above a partial exclusion (up to $20,000 a year starting with tax year 2025, with income limits, and that provision is set to expire before 2030). If "should you stay or go" is a real question for you, the tax math is part of the answer. Verify against each state's revenue department before you decide.
[Illinois Department of Revenue; Texas Comptroller; Florida Statutes; MOAA state tax updates. Verify with each state's revenue department.]
This is information, not advice. You decide if it applies to your situation.
An honest check before you decide
- Steadiness and pay trade against each other in this data. If you took the steadier, lower-paying option, what would you do with the certainty it buys you?
- An industry that held steady in 2008 was not automatically the one that held steady in 2020. If the next downturn looks nothing like the last two, what's your plan?
- The benefits-access numbers above show a wide range by industry. Have you actually checked what a specific employer offers, or are you assuming it based on the industry's reputation?
- The blind spot this page named: no data can tell you how long you personally will stay employed anywhere. If steadiness is what you want, what would you build for yourself if the job disappeared anyway?
Weighing pay and upside over predictability instead? See the Career-changer path. Thinking about building something of your own? See the Founder path.
Before you go
Get updates when new data or a new path ships (one confirmation email first, unsubscribe anytime). Or answer three quick feedback questions; your answers tell me whether to keep building these.
Support the work · offsets the data and build costs. Optional.